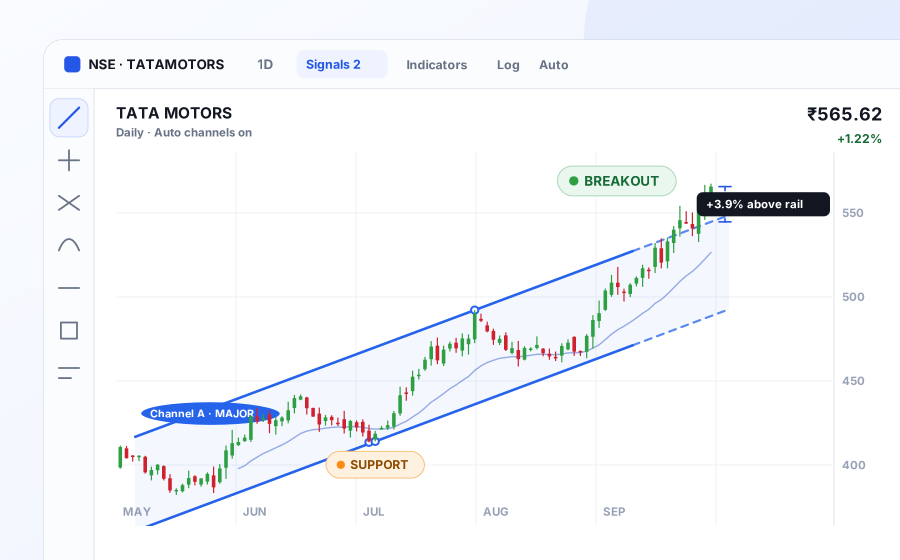
01Chart canvas
Charts & Signals
See channels, rails, signal state, and distance on the chart where the setup is happening. Signals surface across the whole list, each attached to its chart.
Explore charts and signalsThe complete workspace
Charts, signals, watchlists, and market breadth stay together in one chart-first workspace.

Product tour
Each preview shows the real vocabulary and working shape of the product.
See channels, rails, signal state, and distance on the chart where the setup is happening. Signals surface across the whole list, each attached to its chart.
Explore charts and signals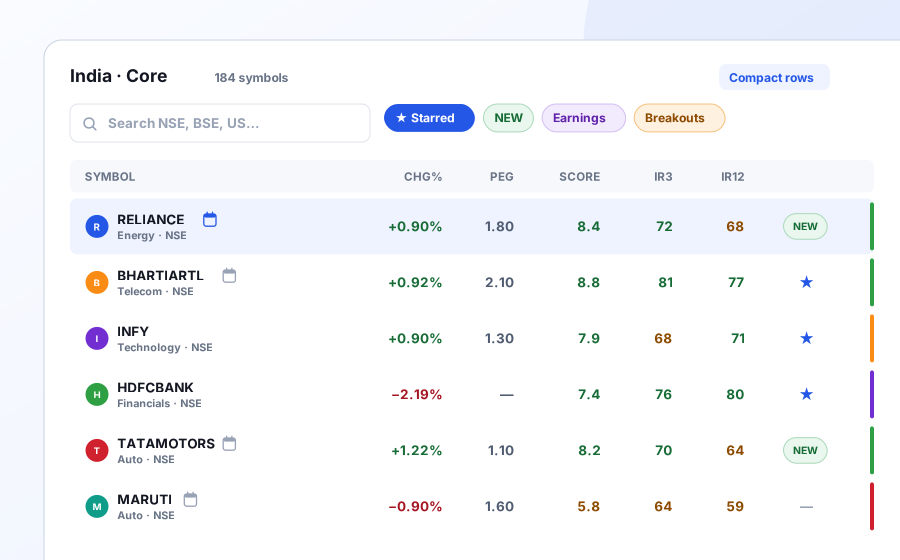
Scan Chg%, PEG, Score (0–10), IR3, IR12 and Revenue and EBITDA trend percentiles, with signal stripes and Starred, NEW and earnings state, without opening every symbol.
Explore watchlists and screening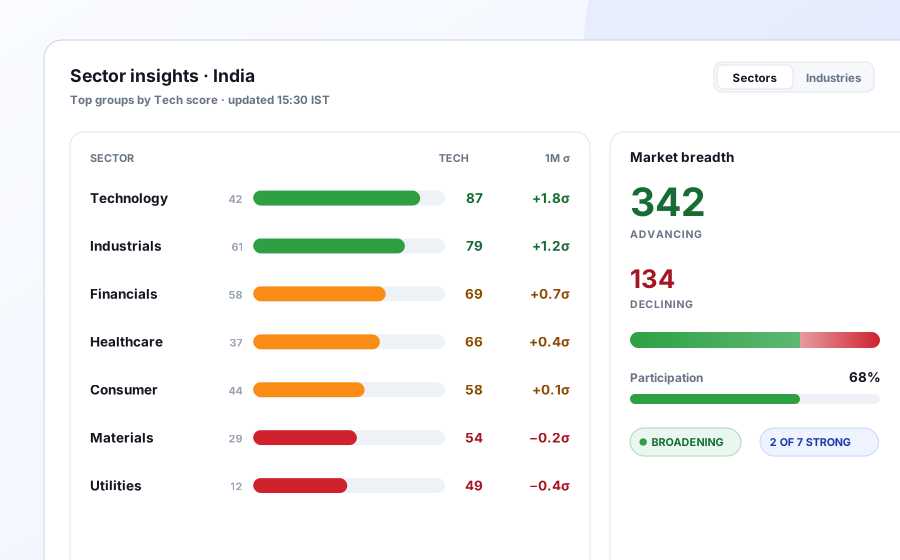
Check whether a move has sector strength and wider market participation behind it.
Explore sector and breadth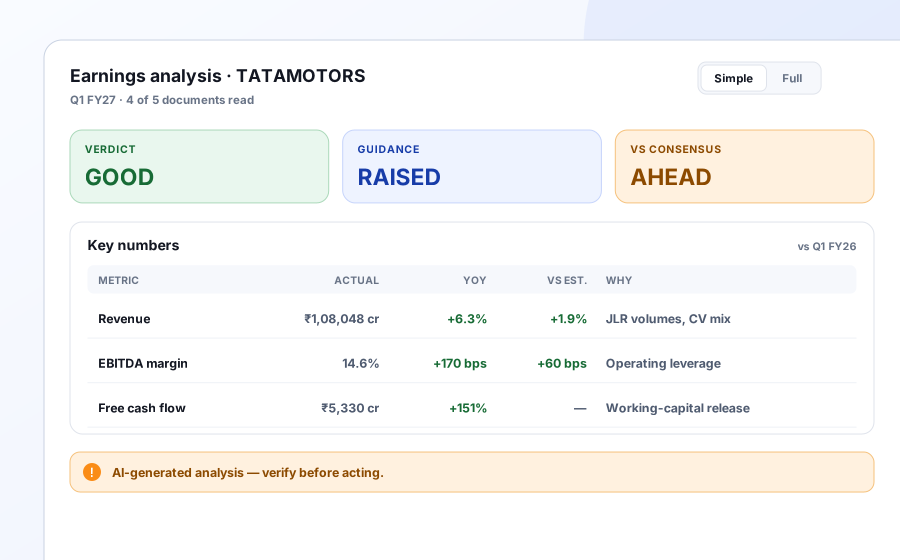
Read structured Earnings, Headwinds & Tailwinds (H&T), and Valuation views with verdicts, guidance, and source coverage.
AI-generated analysis — verify before acting.
Preview the future research tierBuilt around the real screen
Launch scope
Charts, signals and two curated watchlists (India, US) launch in the Free tier, with your own stars, columns and filters. Paid tiers arrive later with prices shown as TBA until the plan is final.
Join the early-access list. Invitations go out in small groups.Open the app and start with the guide.