Participation
When an index rises while fewer of its stocks sit above their 50-day EMA, fewer stocks are carrying the move. When most stocks are above all 3 averages, the trend is broad.
Is a rally broad, or carried by a few large stocks? The breadth panel counts how many stocks in each index are rising, trending up and making new highs, for market, sector, theme (India) and industry (US) indices.
Each row is one index. Each column counts the index’s member stocks, not its points, so a heavyweight moves a breadth figure no more than any other stock.
Switch between India and the USA, choose the broad market, a sector, theme (India) or industry (US) group, search for an index and sort by any column. The table is rebuilt once an hour and shows when it was last updated.
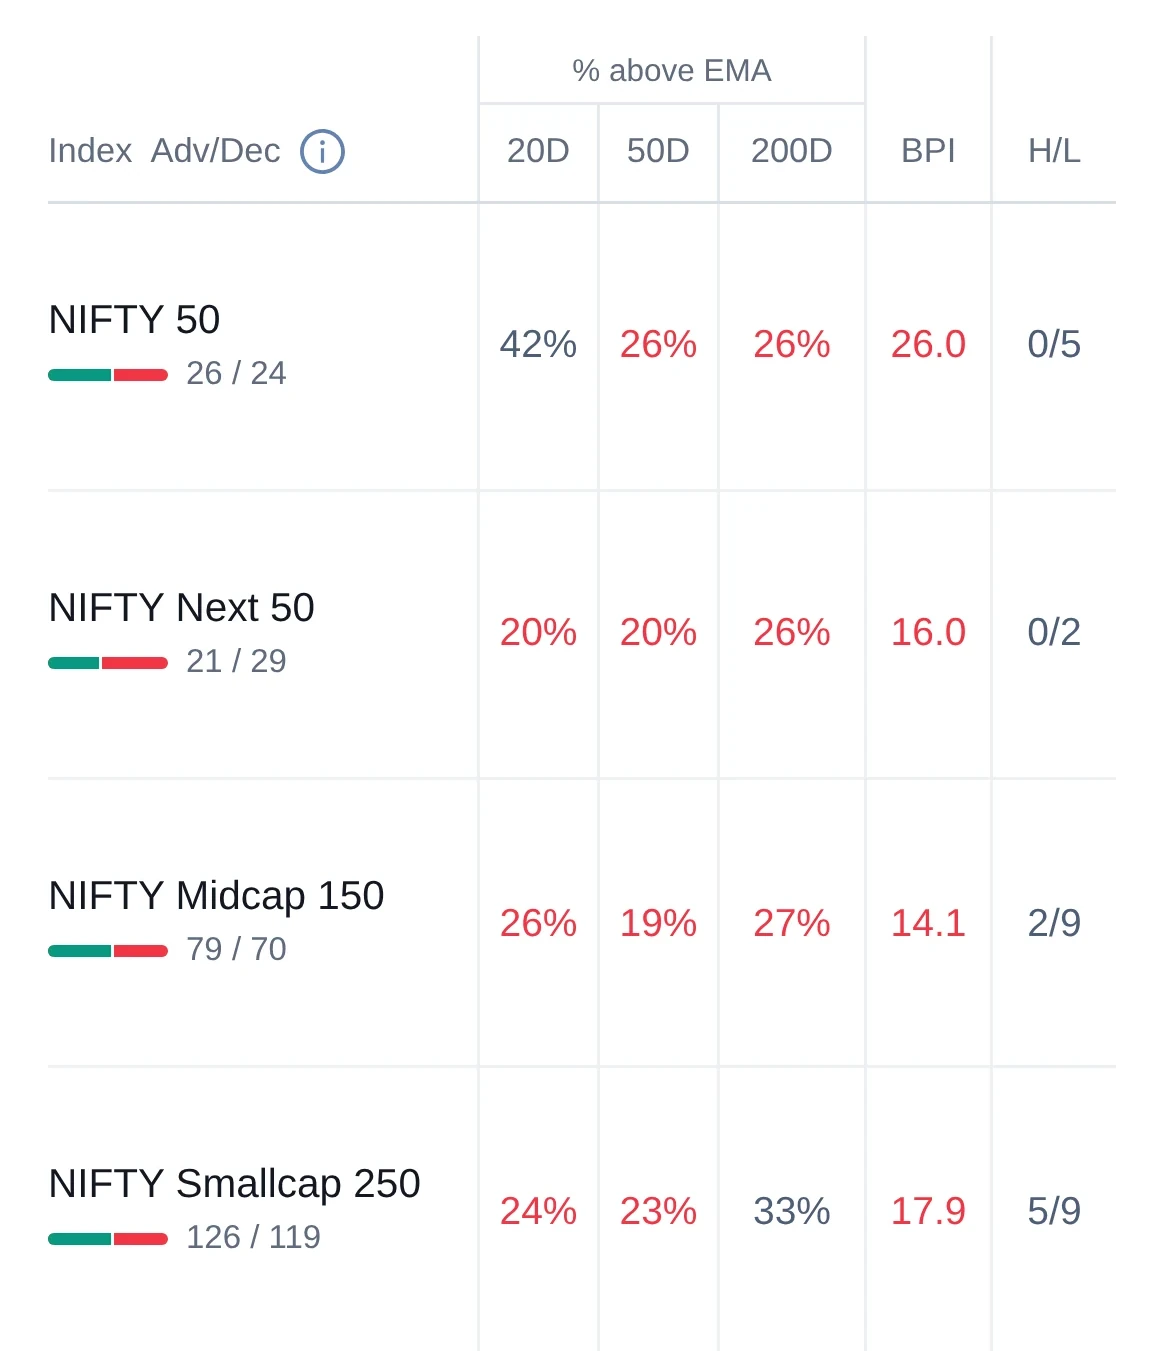
Breadth tells you how wide a move is, not where the index goes next. Read the columns together.
When an index rises while fewer of its stocks sit above their 50-day EMA, fewer stocks are carrying the move. When most stocks are above all 3 averages, the trend is broad.
The 20-day share turns first and the 200-day share last. A falling 20-day share under a high 200-day share often marks a short pullback inside a longer uptrend.
More new highs than lows backs a rise; lows that pile up while the index holds steady point to weakness under the surface. Green marks readings of 70 or more and red 30 or less: extremes worth a look, not instructions to trade.
To see what the same indices cost against their earnings, open index valuation.
Join the early-access list. Invitations go out in small groups.Join thousands of investors who use Chart in Motion every day.