PE needs growth beside it
A PE of 20 can be modest for fast growth and steep for slow growth. Implied growth turns the PE into the growth rate the price assumes, so you can set it against trailing and forward EPS growth.
What does the market pay for each rupee or dollar of profit, and how fast is that profit growing? Compare market and sector indices in India and the US on the same terms.
Each row is one index, valued from the companies inside it.
Open an index for more detail, or Holdings for the stocks inside it. Groups follow each market: the broad market and sectors, plus themes in India and industries in the US.
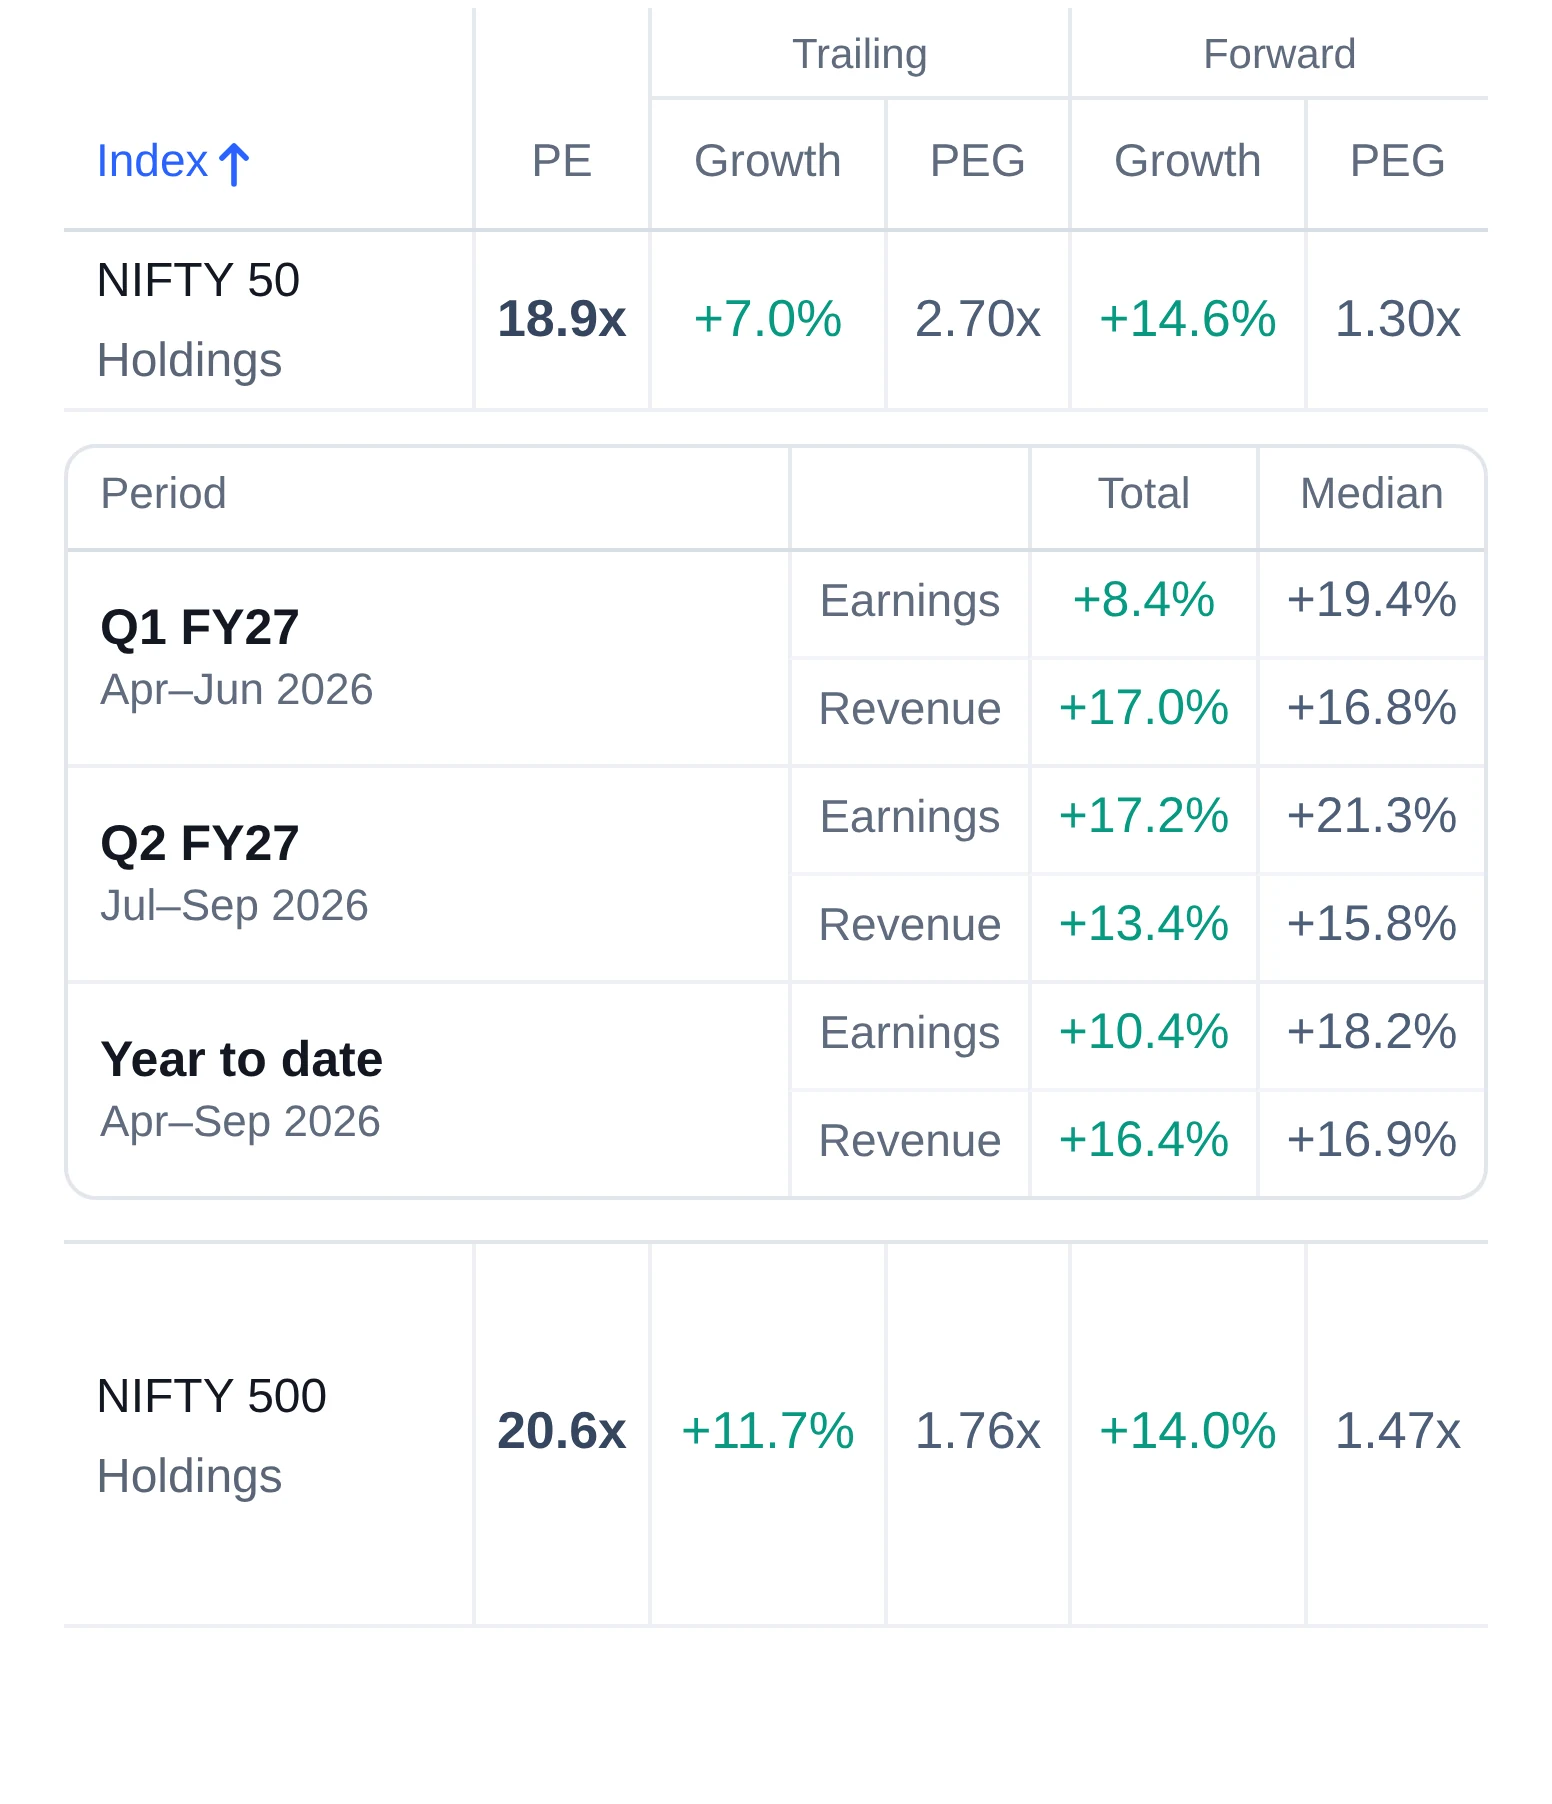
A PE on its own says little. Set it against growth, then check how widely that growth is shared.
A PE of 20 can be modest for fast growth and steep for slow growth. Implied growth turns the PE into the growth rate the price assumes, so you can set it against trailing and forward EPS growth.
PEG puts PE and growth into one number. Compare it across indices, and trailing against forward: a forward PEG well below the trailing one means forecasts expect faster growth ahead.
The total weighs companies by their profit; the median is the middle company. A wide gap means a few big earners drive the figure. Early in a results season only some companies have reported, so growth so far can move as the rest report.
To see how many stocks in the same indices are rising, open market breadth.
Join the early-access list. Invitations go out in small groups.Join thousands of investors who use Chart in Motion every day.