Watch the count
The Show button counts the matching stocks as you add each condition. If one condition empties the list, loosen it before you add the next.
Set a minimum, a maximum or both for each metric, see only the stocks that pass every condition, then open any result’s chart.
Choose Screener in the desktop toolbar and pick the India or USA list. Add up to 5 metrics from 9 groups, from valuation, growth and profitability to dividends, technicals, and momentum and IR.
Results show your chosen metrics as columns. Sort them, then select a row, or step with the arrow keys, to open its chart. Your watchlist stays unchanged, and your criteria are kept on this device.
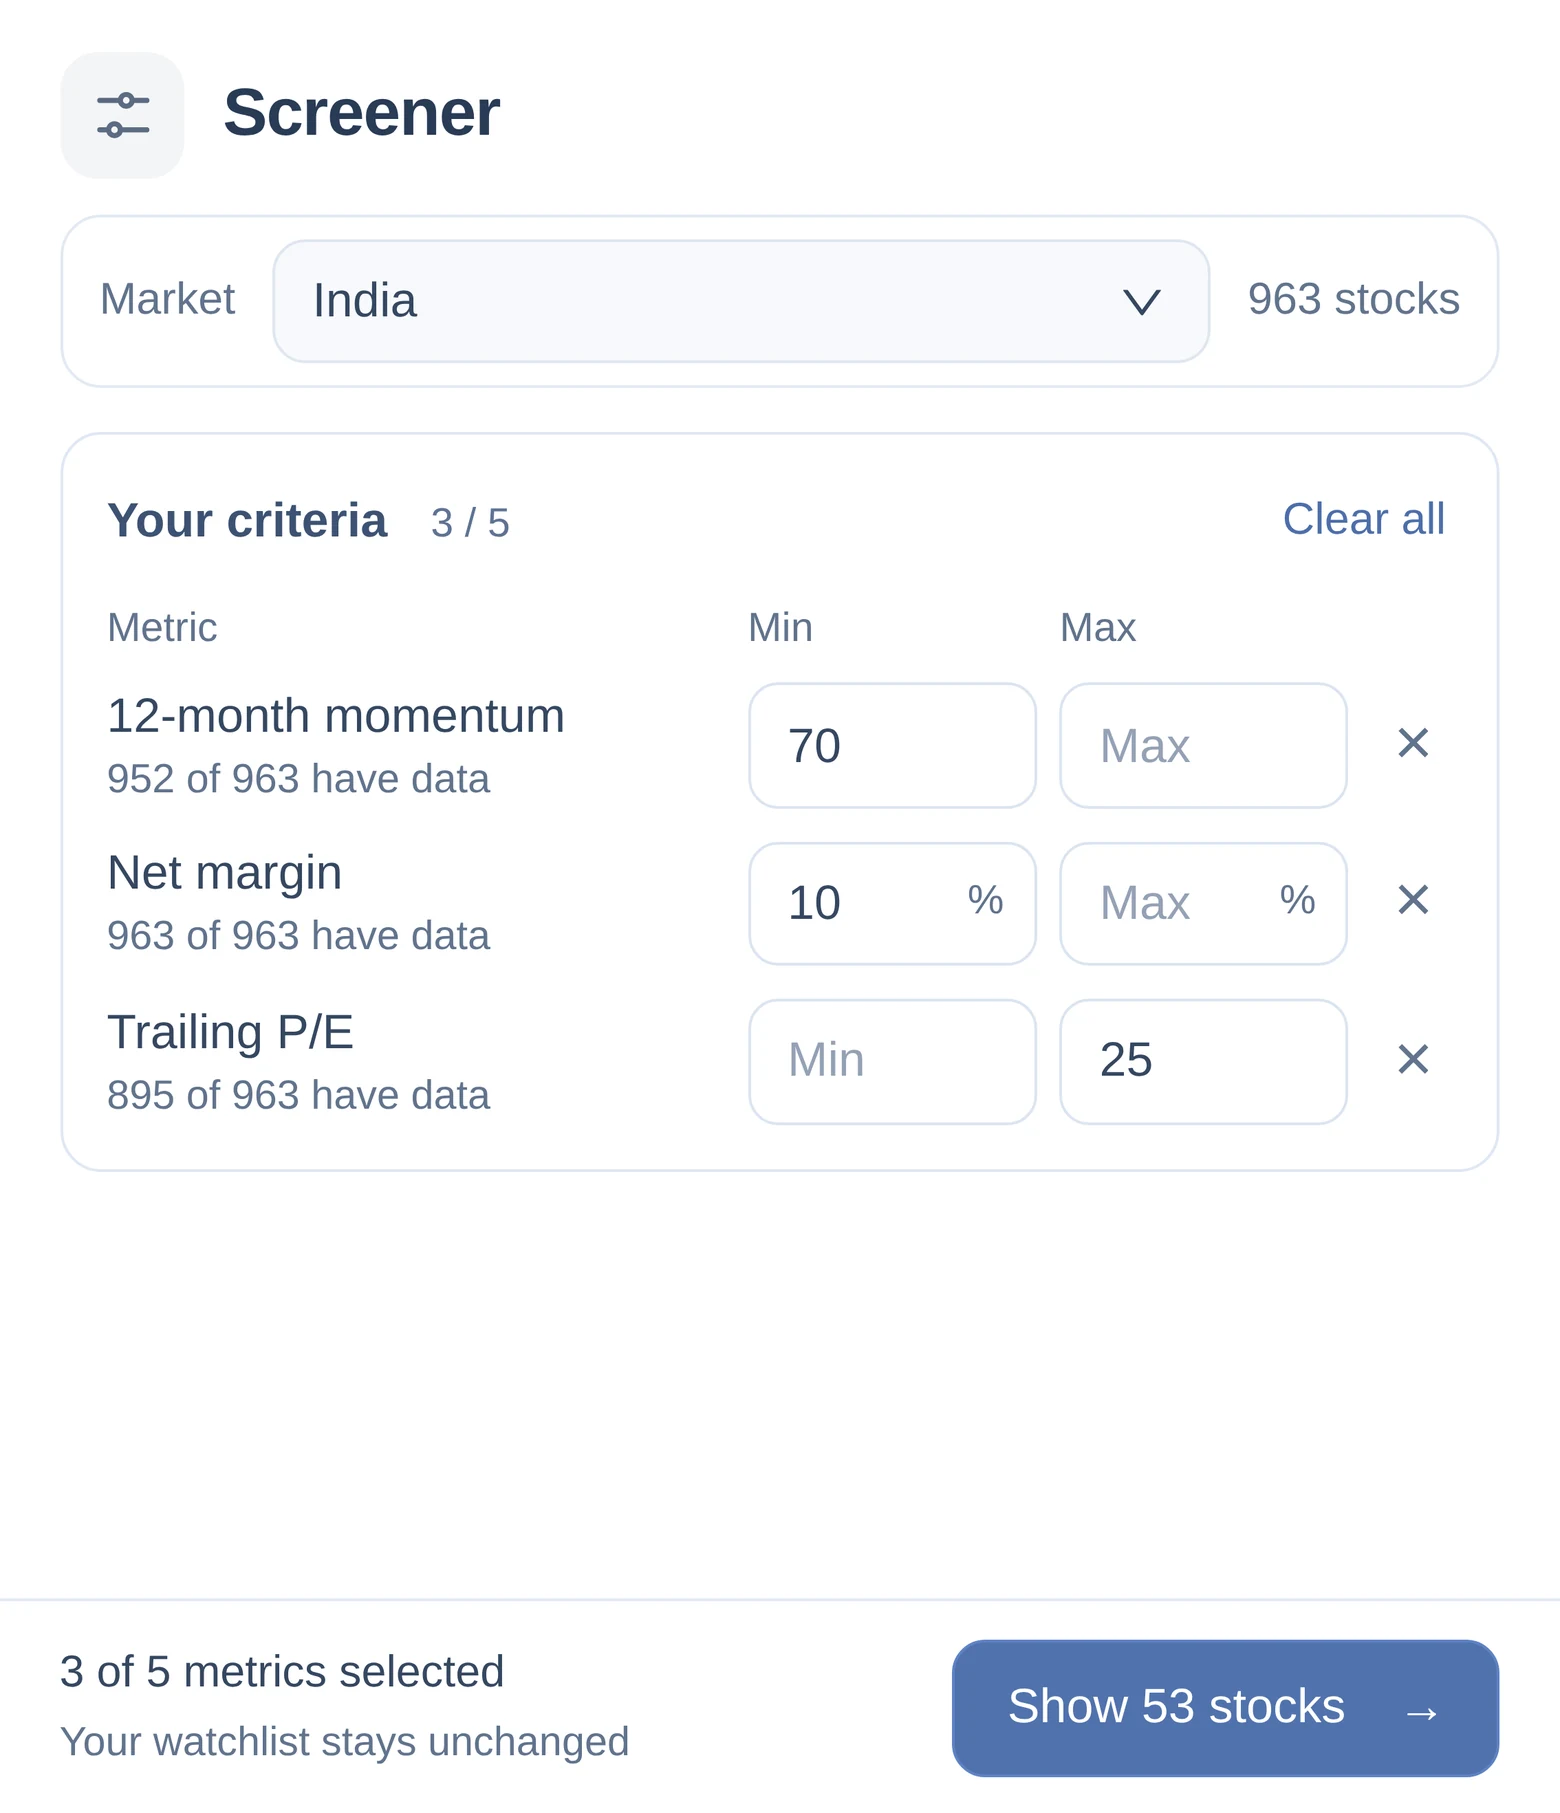
A screen turns a long list into a short one. These habits keep it honest.
The Show button counts the matching stocks as you add each condition. If one condition empties the list, loosen it before you add the next.
Each metric shows how many stocks have data. A thin metric drops stocks for lack of data, not because they failed the test, so read its coverage before you rely on it.
The screener does not rank results as buys. Open each chart, read its fundamentals and decide for yourself.
The screener is part of Pro and Pro+ and runs on desktop; see pricing.
Join the early-access list. Invitations go out in small groups.Join thousands of investors who use Chart in Motion every day.