Four-step setup

From sign-up to a useful watchlist.

This short guide carries the first-run workflow until onboarding lives inside the app. You will open a chart, understand one signal, and make the curated lists yours.

Create access

Sign up and enter the workspace.

During the private beta, join the early-access list. When your access is ready, use the link in the invitation to create your account.

  • Use an email address you can access.
  • Keep your account credentials private.
  • Start in the main chart view after signing in.
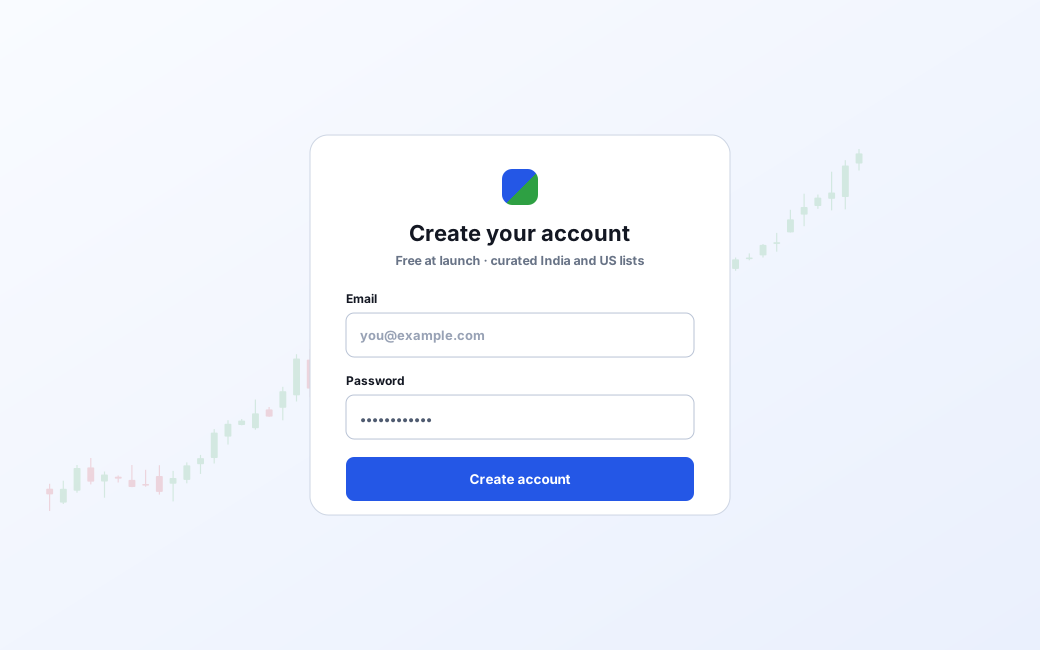
The sign-up screen with email and password fields and no personal information
Illustrative data. Prices, signals and verdicts are drawn examples, not product output.

Search the market

Find your first symbol.

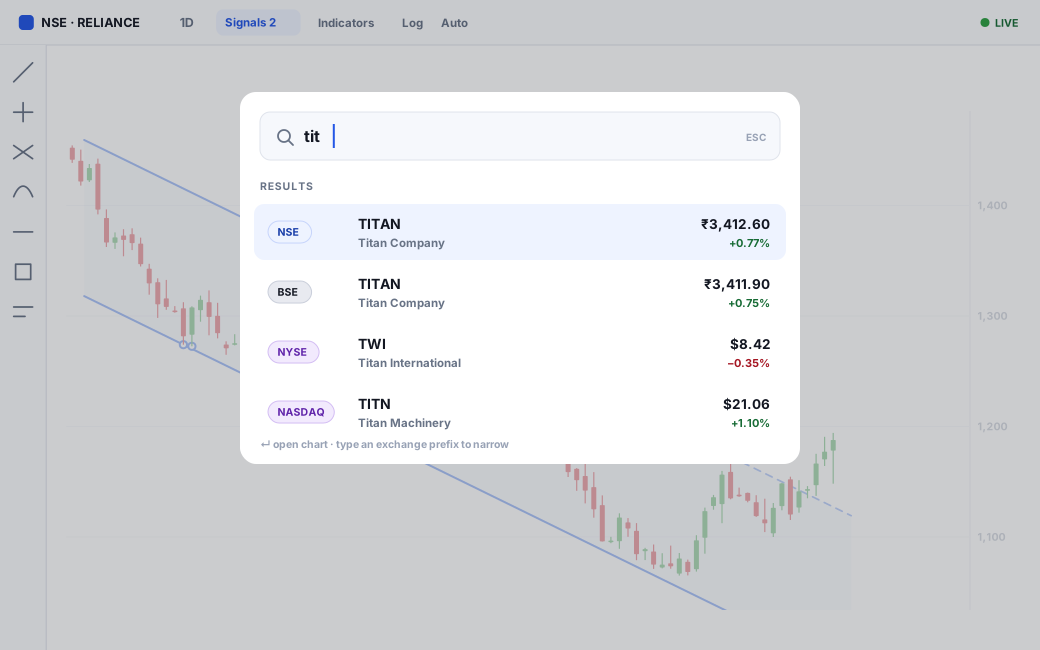
Open symbol search and type a company name or ticker. The beta covers a curated set of about 1,600 NSE, BSE and US symbols; a symbol outside that set will not appear yet. Select the symbol to load its chart.

  • Check the exchange before choosing a result.
  • Select the symbol to load its chart.
  • If two tickers look similar, confirm the company name and market.
Symbol search open over the chart with NSE, BSE and US results
Illustrative data. Prices, signals and verdicts are drawn examples, not product output.

Read the chart

Put the signal in context.

The chart can draw trendlines and channels, then label nearby price behaviour. A chip is a compact description of what the detector sees. It is not an instruction to trade.

  • Breakout
  • Support
  • Breakdown
  • Rejection

Check the line, timeframe, distance, recent price action, and data freshness. A signal without context is incomplete.

A worked example

Search TATAMOTORS and open the chart. The channel drawn across the last few months is labelled Channel A · MAJOR: two lines, called rails (one line of a channel), that contained price. A shorter pullback inside it is B · minor. The green Breakout chip sits on the bar that first closed above the ceiling, and the dashed connector reads the distance from today’s close to where that ceiling is now — a few percent above the rail, inside the default 8% band, so the chip stays on the row. What you do next is yours: the chip has not told you to buy anything. Check the timeframe, the recent bars and the data freshness first.

A daily chart with an automatic channel, a Breakout chip and the percentage-distance connector
Illustrative data. Prices, signals and verdicts are drawn examples, not product output.

Make the lists yours

Work the curated lists.

Switch between the India and US lists, choose the metric columns you read, star the rows you follow, then use the Starred, NEW, earnings and signal filters to narrow the list.

  • Keep only columns you actively read.
  • Use NEW markers to review changes after a refresh.
  • Creating and editing your own lists arrives with the Plus tier.
The compact watchlist sidebar beside the chart with symbol and Chg% columns, signal stripes, starred rows and NEW markers
Illustrative data. Prices, signals and verdicts are drawn examples, not product output.

Next

Move from one symbol to market context.

Once the list is useful, open Sector & Breadth to see whether a move is isolated or shared. Keep the chart as the final place where you inspect the setup.

Ready when your invitation lands.

Join the early-access list. Invitations go out in small groups.

Get early access