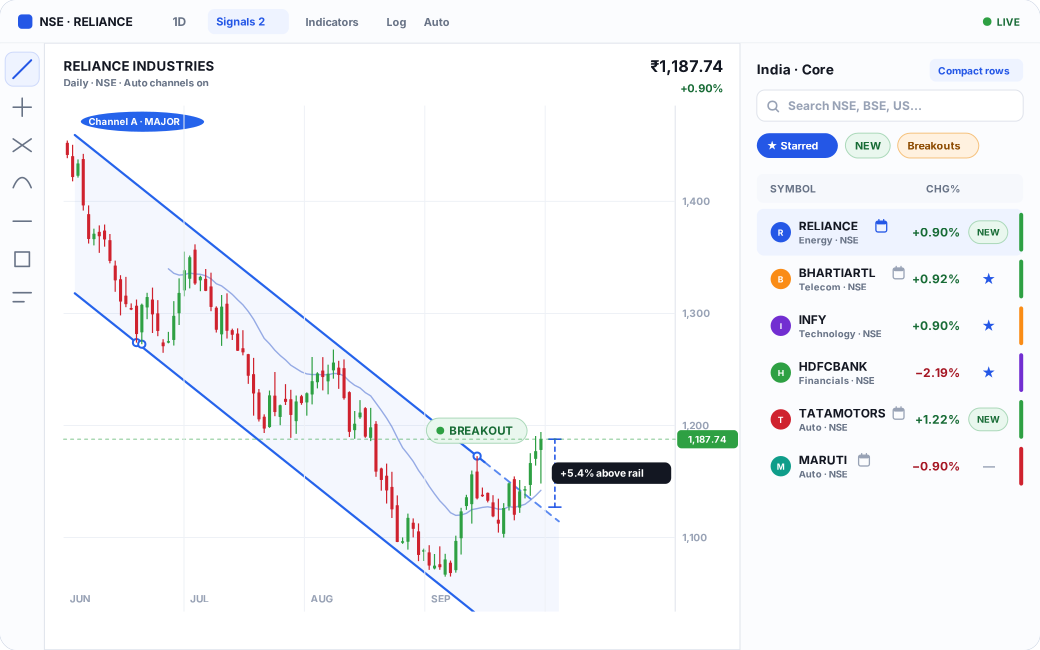
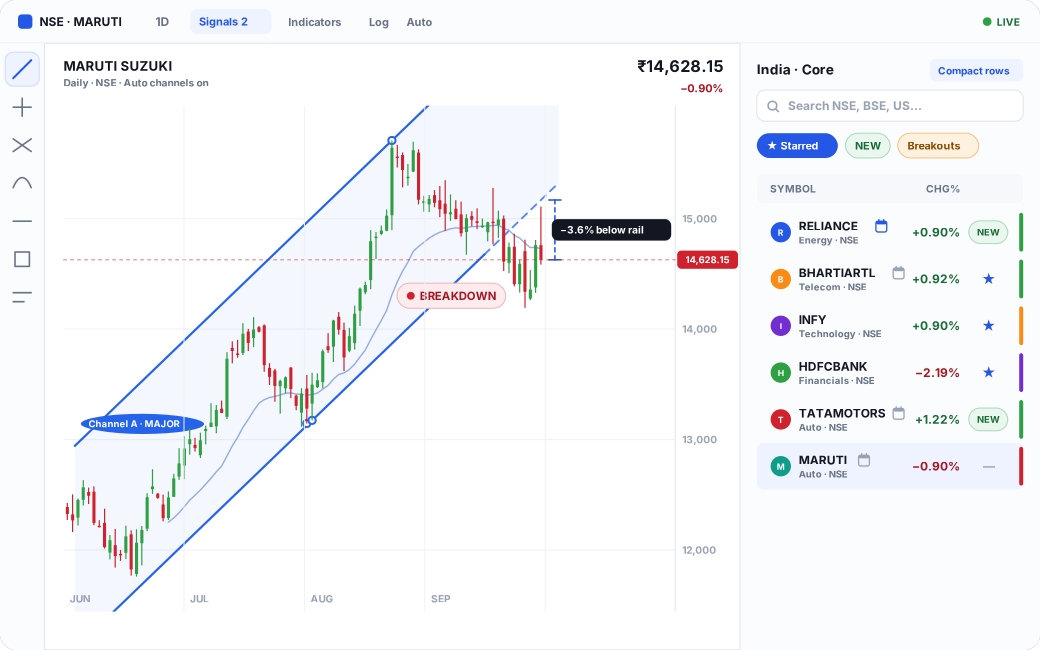
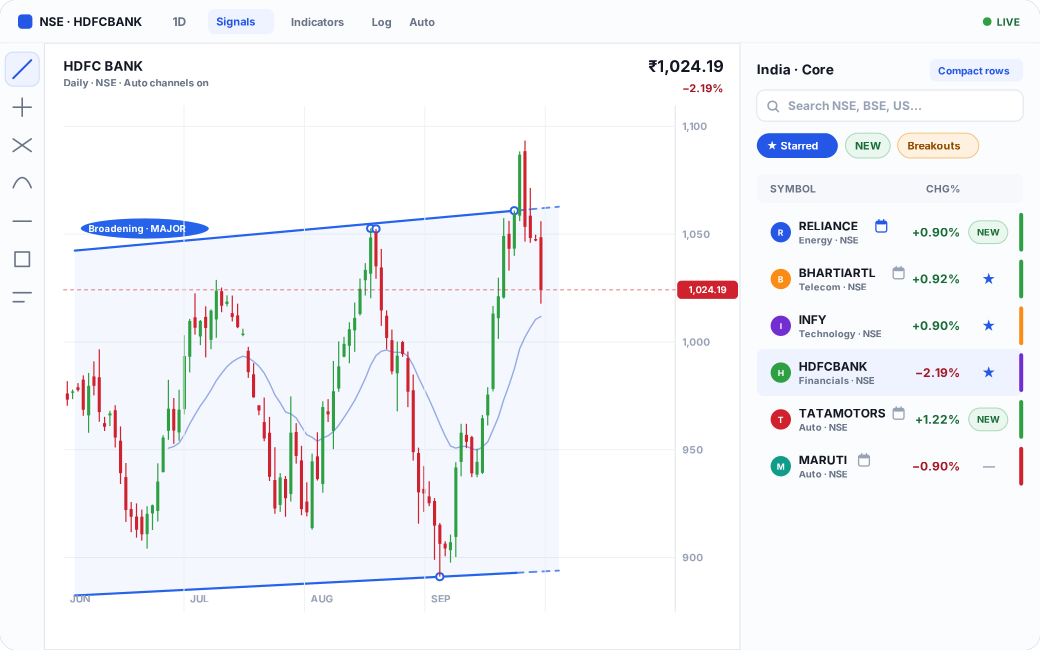
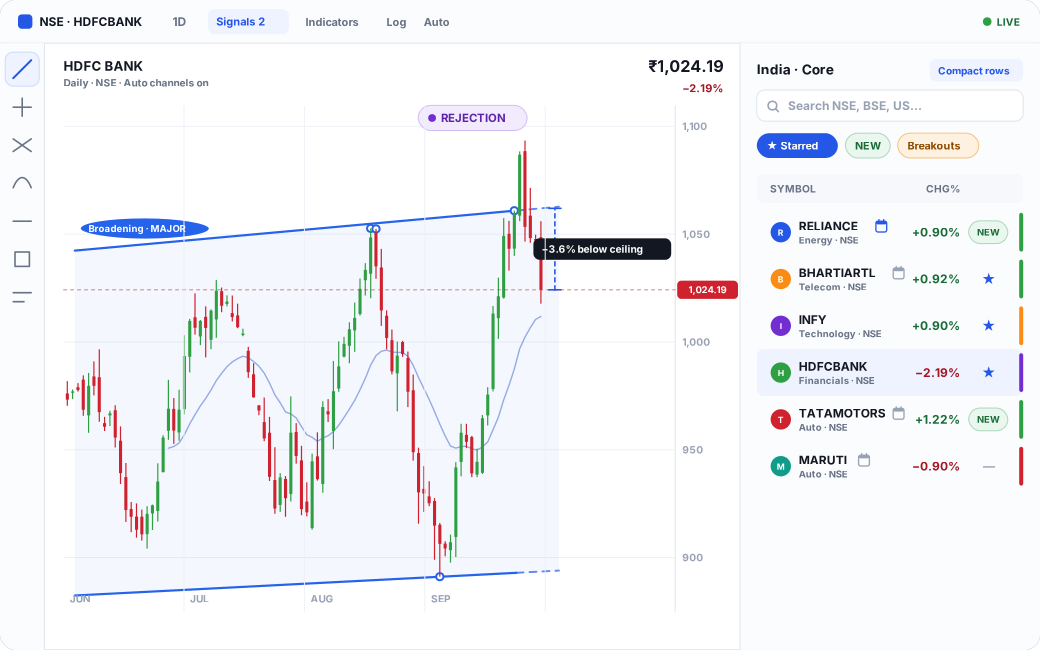
Price clears a ceiling
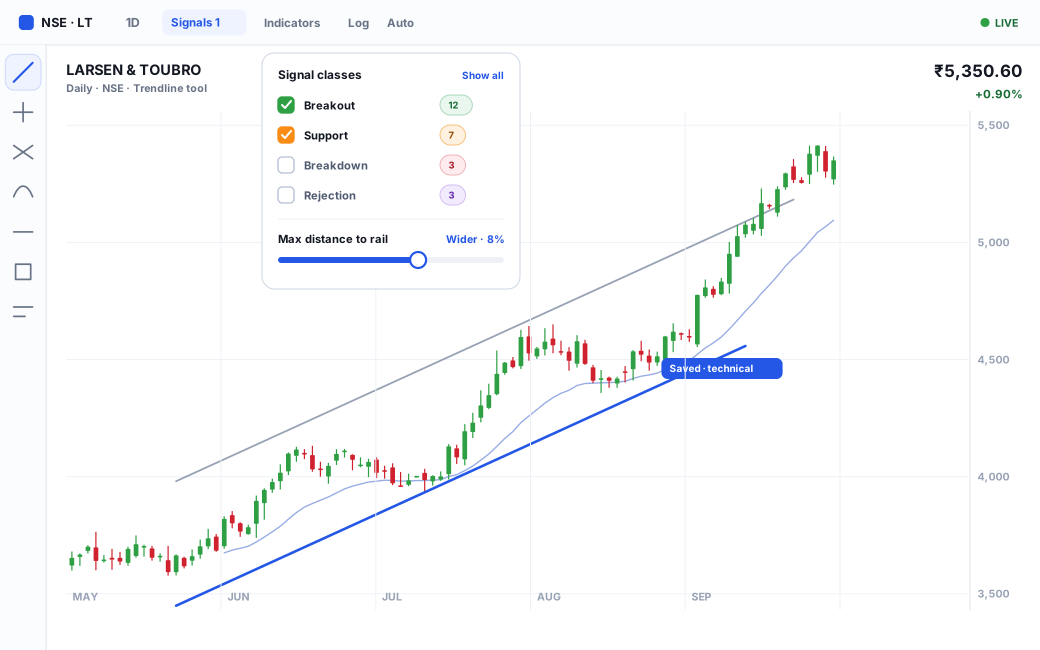
The chart marks the relevant rail and keeps the current percentage distance visible.
Charts & Signals
A signal matters only when you can see where it came from. Chart in Motion keeps the channel, rail, class, and distance together on the chart.
The core moment
Type an exchange and symbol, let the chart load, then inspect the relevant channel without opening a separate report or losing the watchlist.

Watchlist scan
Signals describe chart geometry. They are not recommendations.
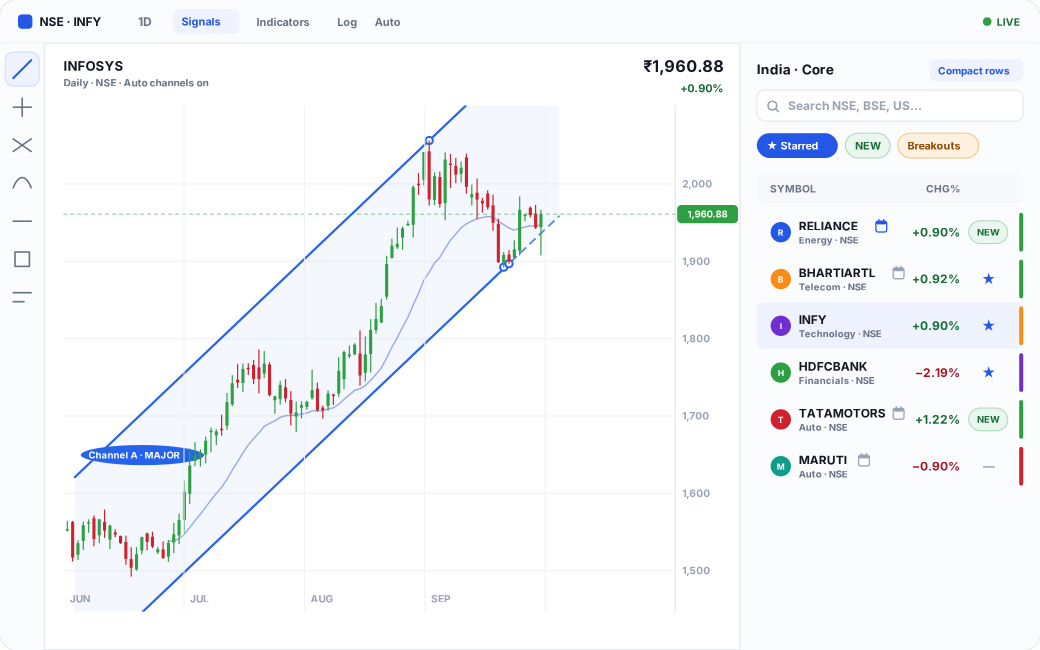
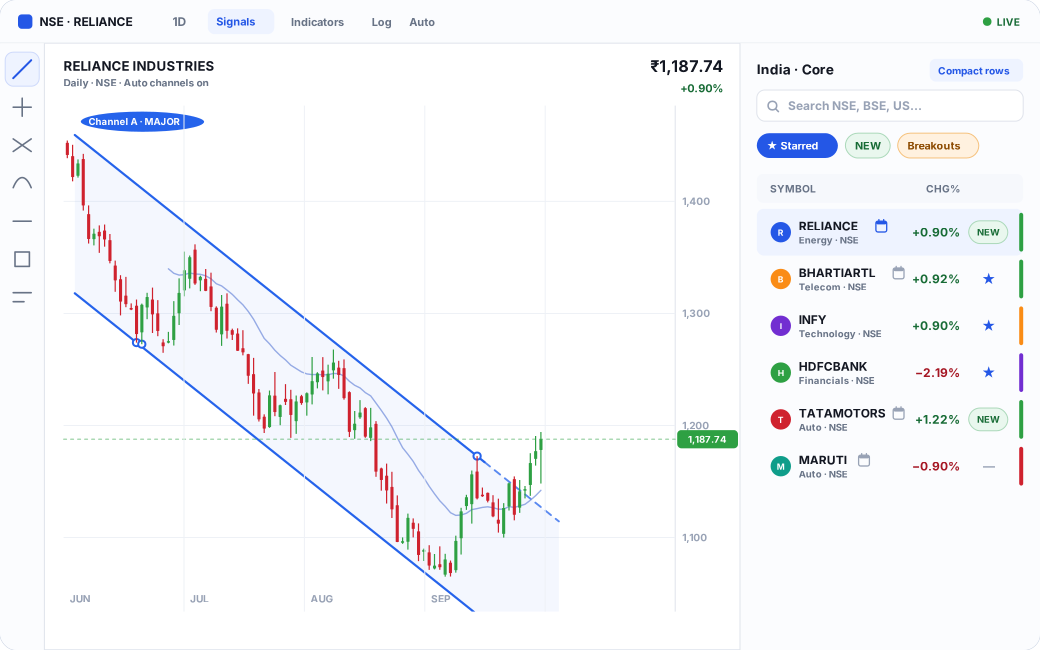
Every symbol on your watchlist is scanned for channel states. Each signal shows up as a chip on its row, and opening it lands you on the chart with the rails, the class, and the distance already drawn.
How a signal is computed
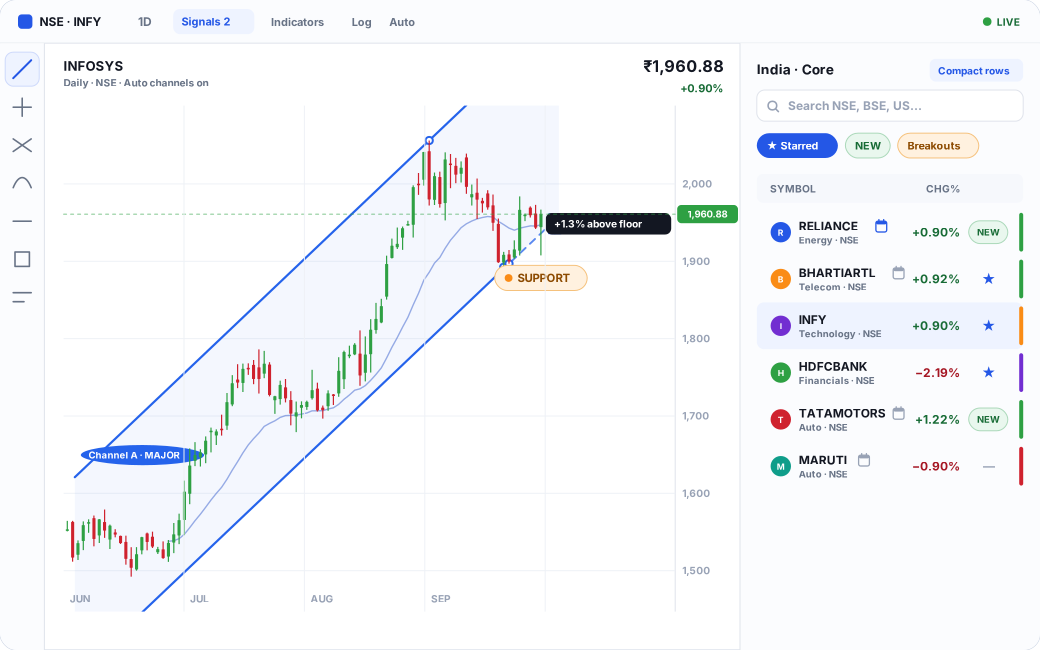
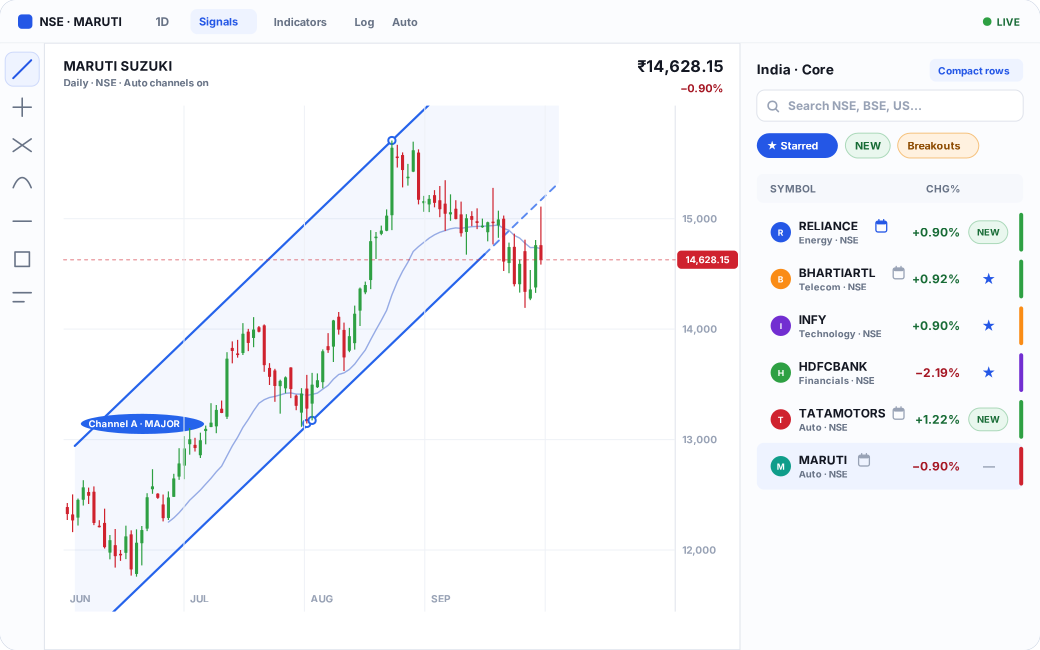
Every chart carries saved trendlines. Two lines that contained price form a channel; the longest live one is MAJOR. Each day the detector compares the latest close with every channel line: a close 0.1% to N% above a ceiling is a Breakout, 0.1% to N% below a floor is a Breakdown, a close within N% above a floor is Support, and a close held under the ceiling of a falling or flat structure is a Rejection. N is your distance setting (2%, 4%, 8%, 15% or a custom value; 8% by default). A chip stays on the row for as long as price stays in that band, and the row shows how many days since the cross or touch. Signals are recomputed from end-of-day bars; a chip can appear late and disappear without any new event.
Four signal classes
The app uses a stable colour and vocabulary for each signal class. The marketing site preserves the same language.
The chart marks the relevant rail and keeps the current percentage distance visible.
Support stays orange so it cannot be confused with a completed Breakout event.
The red state separates a lost structural floor from an ordinary negative session.
Purple keeps the rejection state distinct from constructive and destructive channel events.
Work without covering the chart
The toolbar stays on one line. Signal filters and distance tuning share one compact menu so the data canvas remains the focus, and the saved structure behind each signal is drawn on every chart.
A tool, not a decision
They do not account for every market, company, liquidity, or portfolio factor. Use them as structured data points, confirm the underlying chart, and make your own decision.
Join the early-access list. Invitations go out in small groups.Open the app and start with the guide.