A label, not a forecast
Breakout and Support describe price holding up against a line; Breakdown and Rejection describe price failing at one. A signal can be late, wrong or incomplete, and it does not tell you to trade.
Each chart comes with its price channels drawn, and each stock gets a label for where its price sits against them. Filter a whole list by setup instead of opening every chart.
A channel is a pair of lines, called rails, around the price. Each carries a tag: MAJOR for the longest active channel, minor for another active one, and dead for one the price left over a year ago without returning. Members see these tags on stocks in their own watchlists. The signal names where the price sits:
The distance setting decides how near counts as near: 2%, 4%, 8% (the default), 15% or your own value. In Signal filters, tick the classes you want and the watchlist narrows to them; No signal shows the rest. Signals follow the live price during the session and settle on the close.
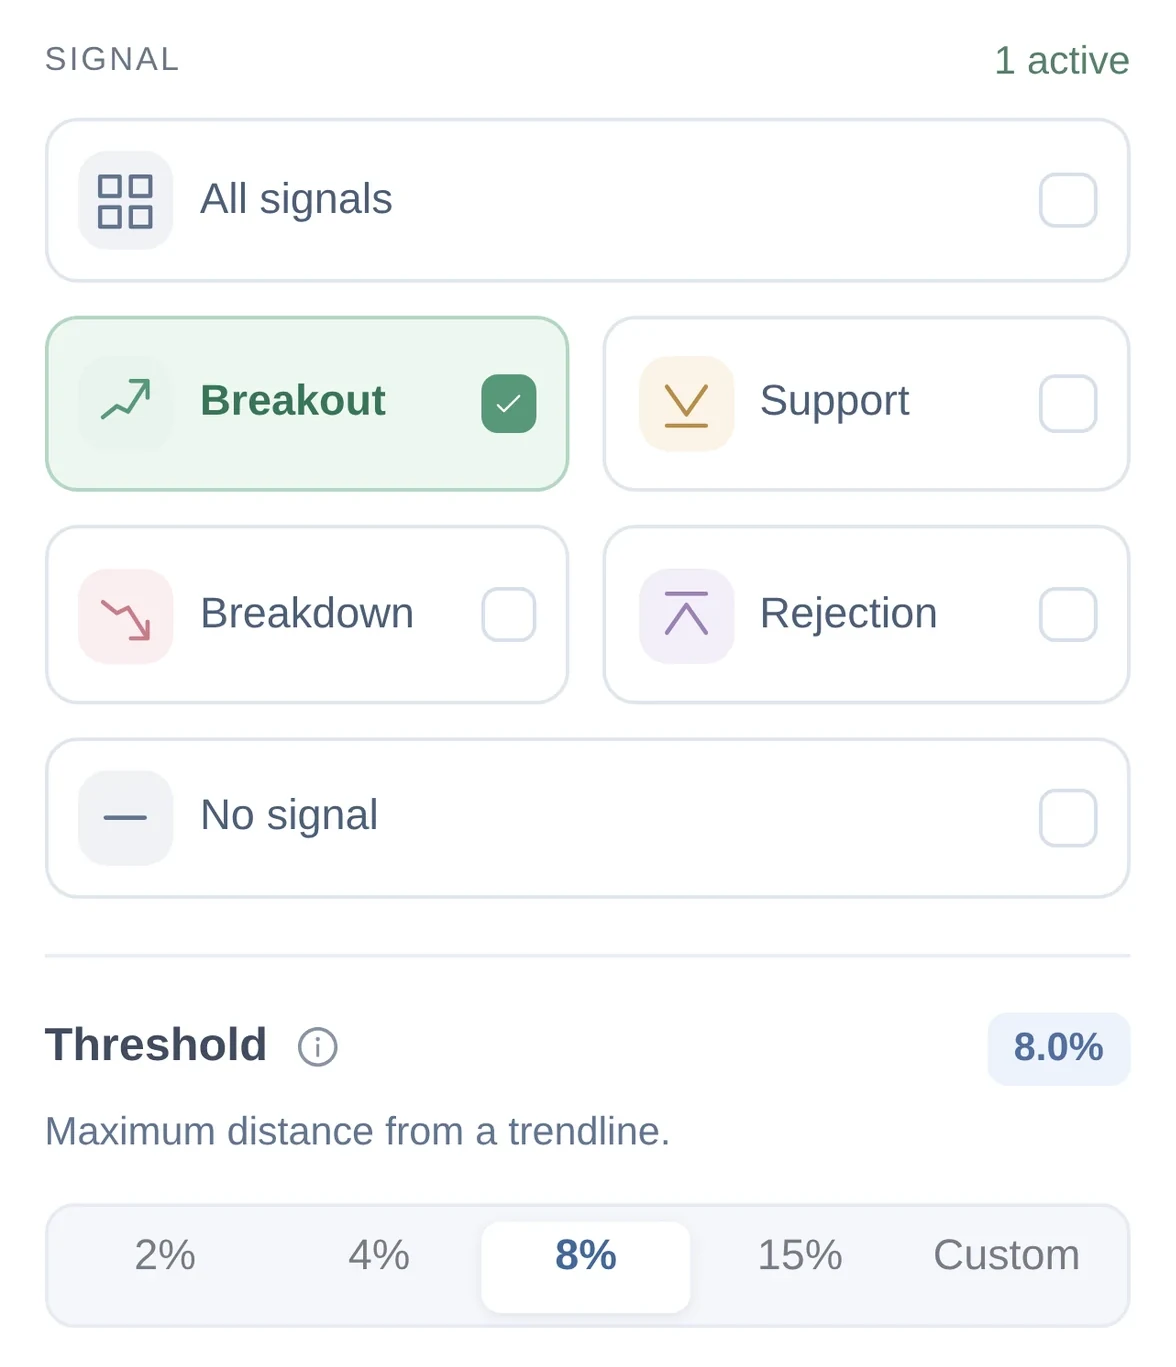
A signal is a short label for a longer story. Read it with the chart behind it.
Breakout and Support describe price holding up against a line; Breakdown and Rejection describe price failing at one. A signal can be late, wrong or incomplete, and it does not tell you to trade.
A MAJOR channel spans the longest stretch of price history, so a signal on its rails has more history behind it than one on a minor channel.
At 2% you see only stocks right at a line. At 15% you see many more, some well away from it. Pick the distance that matches how close to the line you want the price to be.
Signal filters and the distance setting work on desktop and on a phone.
Join the early-access list. Invitations go out in small groups.Join thousands of investors who use Chart in Motion every day.