Check the numbers behind the chart
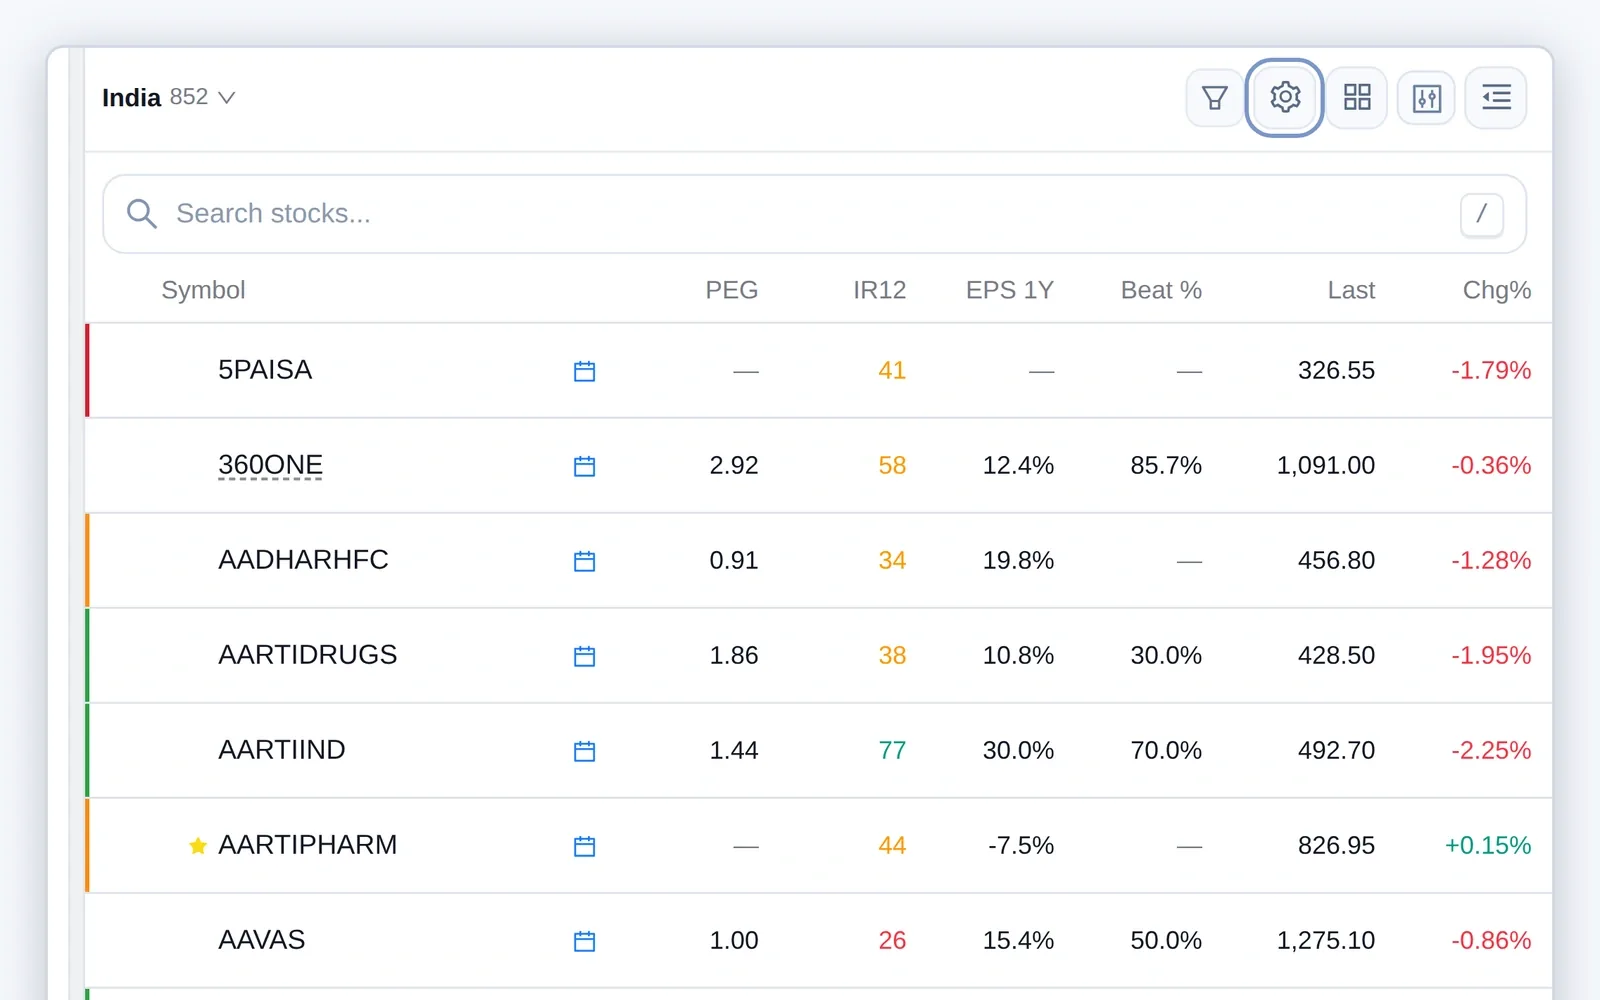
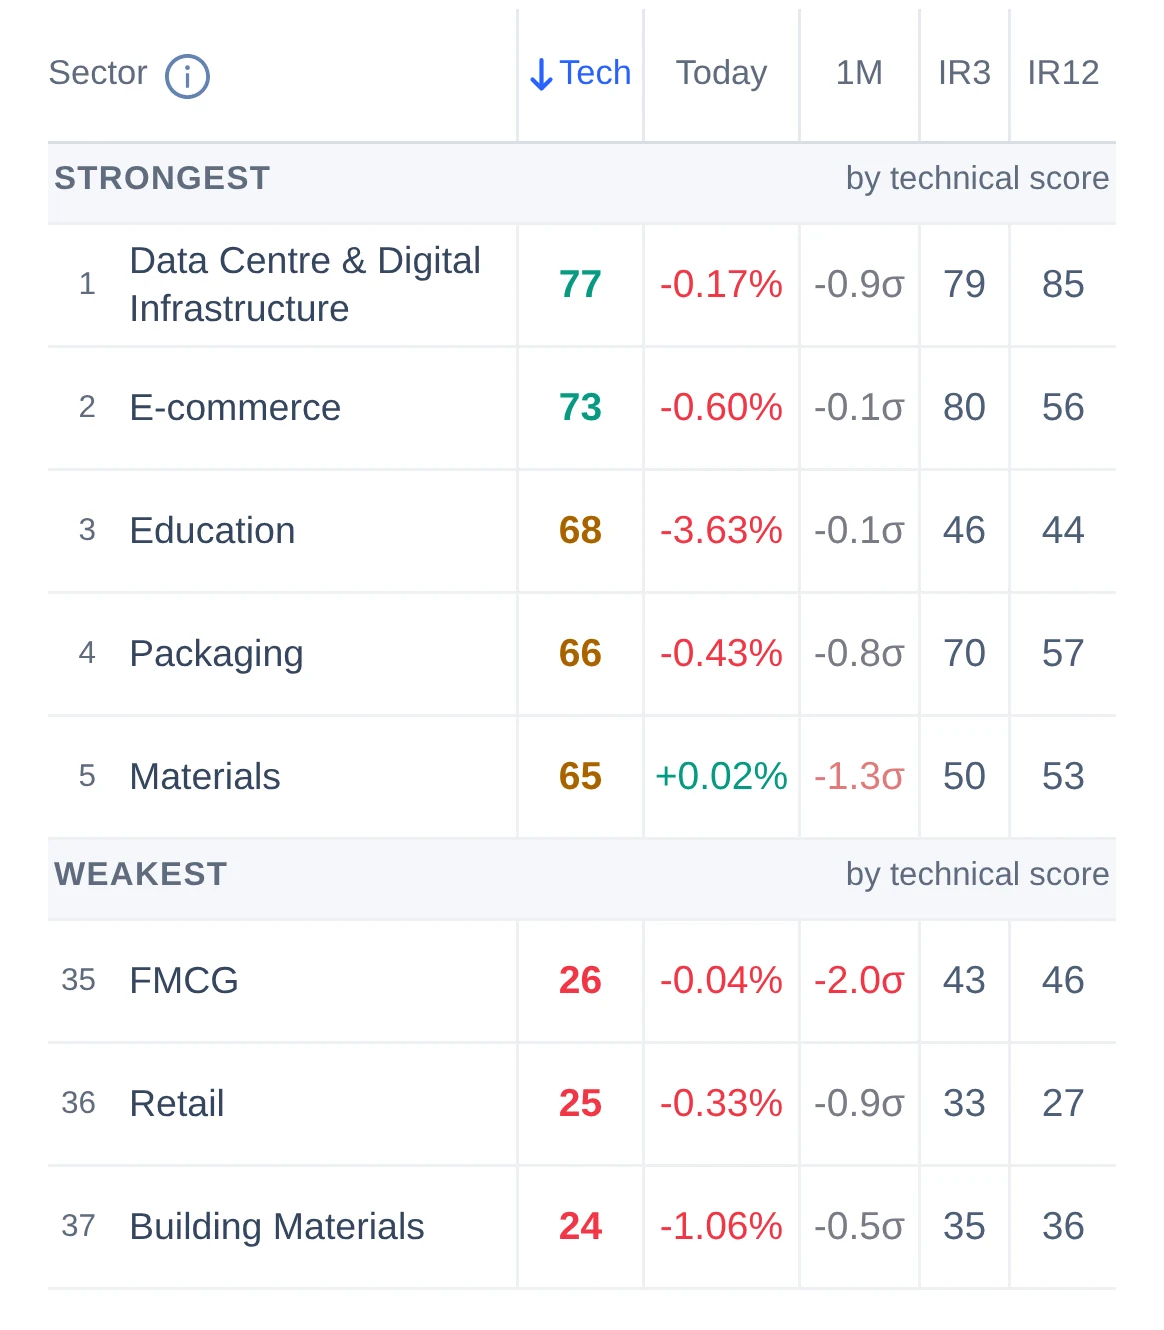
One click from the chart: the stock’s valuation, its EPS and revenue estimates year by year, and its quarters against the estimate.
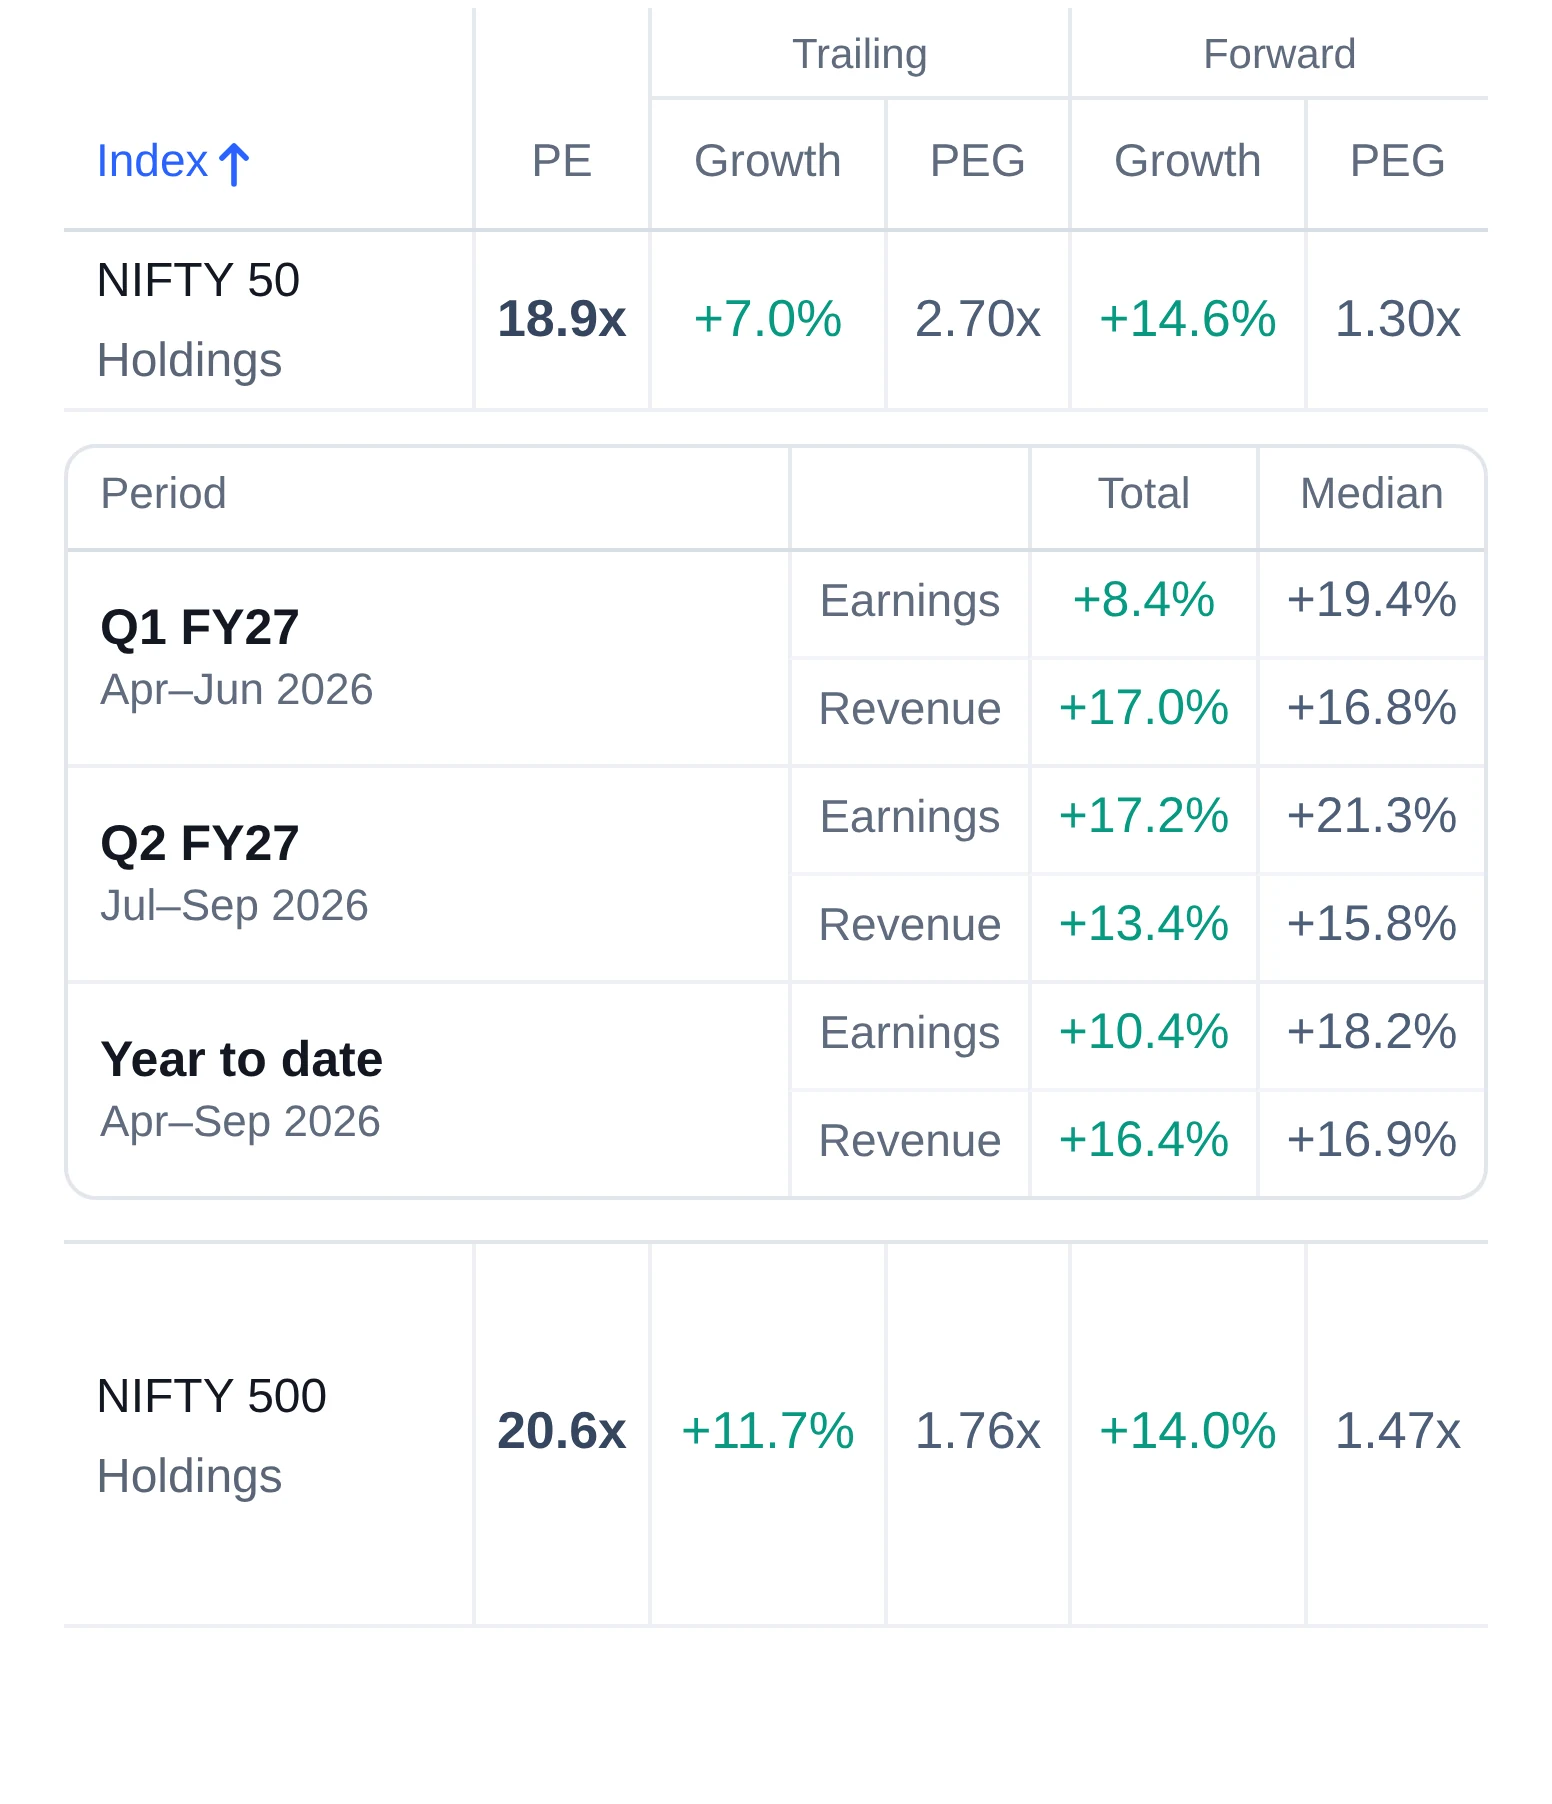
- PE, forward P/E and PEG, with the growth the price implies
- EPS and revenue for 4 reported years and future estimates
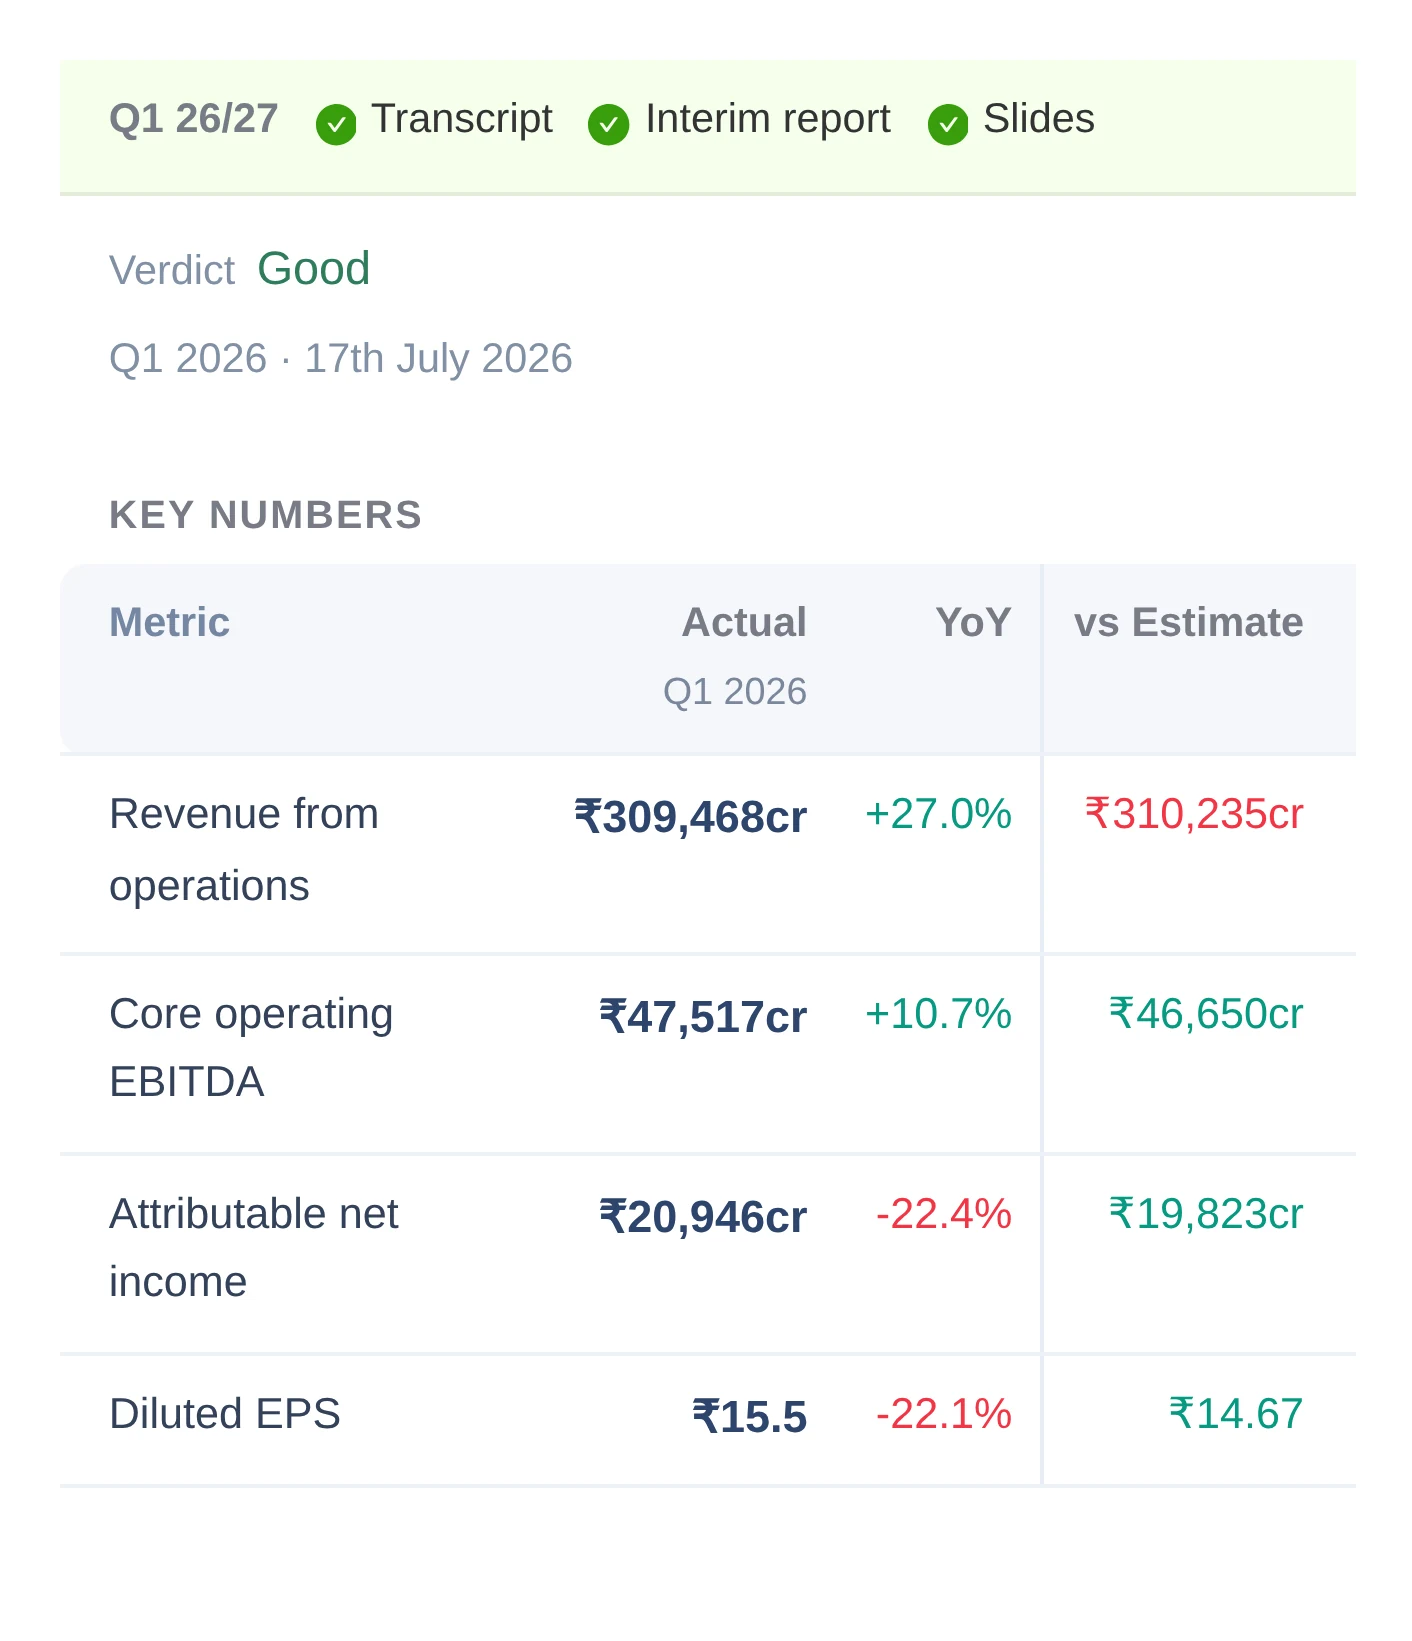
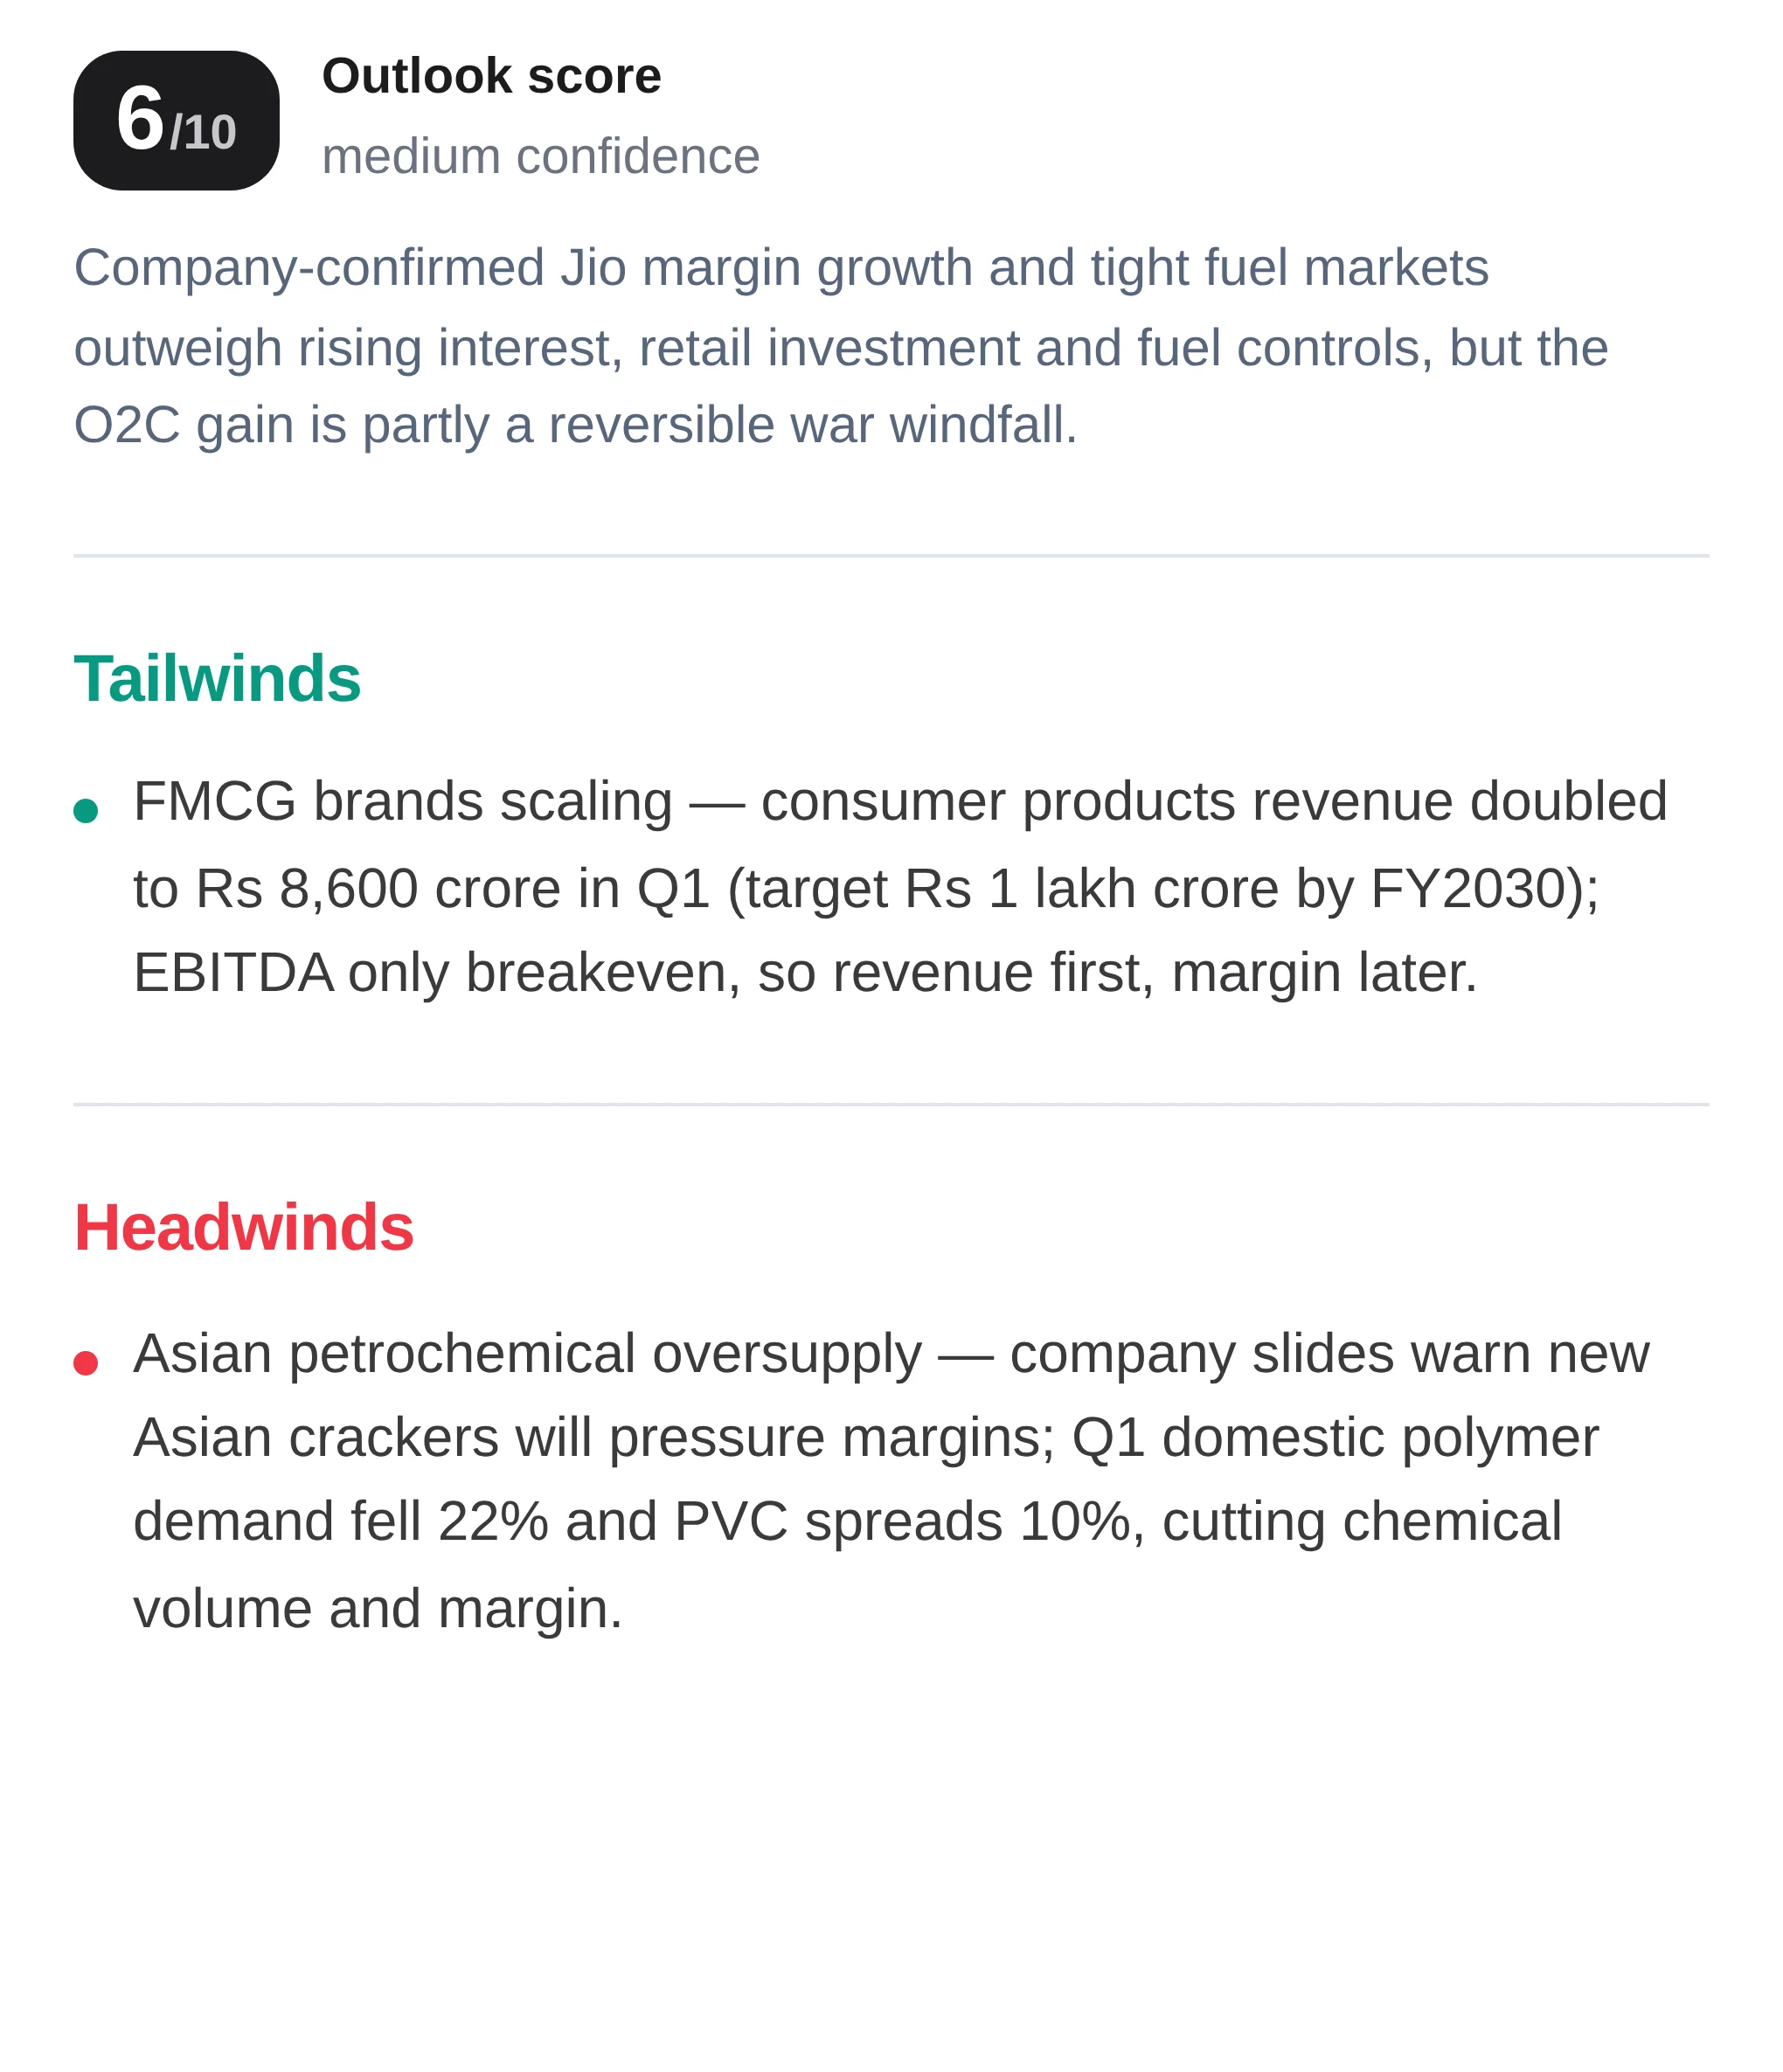
- Each quarter against the estimate, and the next report date